Customer Analytics
Understand who's actually buying from you. Crate's Customers report shows how many customers you have, how many are new, how often they come back, and what each one is worth on average.
The Customers report answers the questions that decide whether a store grows: are new people finding you, and are the ones you already have coming back? Every number is computed from your real completed orders.
What each tile means
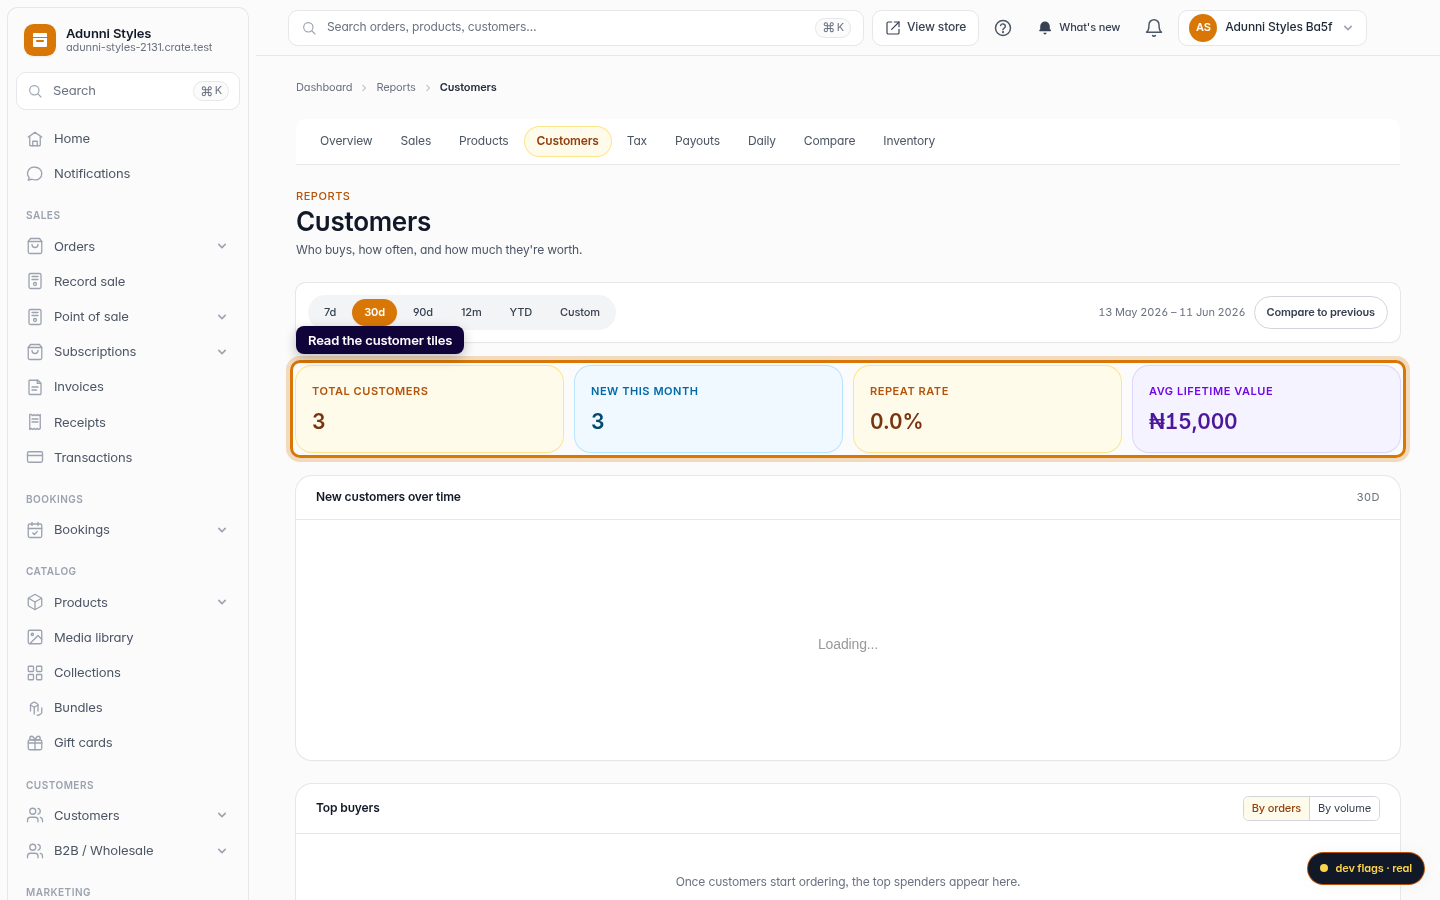
- Total customers — distinct buyers who've placed a completed order with you.
- New this month — customers whose first-ever order falls inside the period, so you can see how many fresh buyers you won.
- Repeat rate — the share of customers who've ordered more than once. A healthy, climbing repeat rate is the clearest sign your store has staying power.
- Avg lifetime value — total revenue divided across all your customers — a quick read on how much an average customer is worth over time.
New customers over time
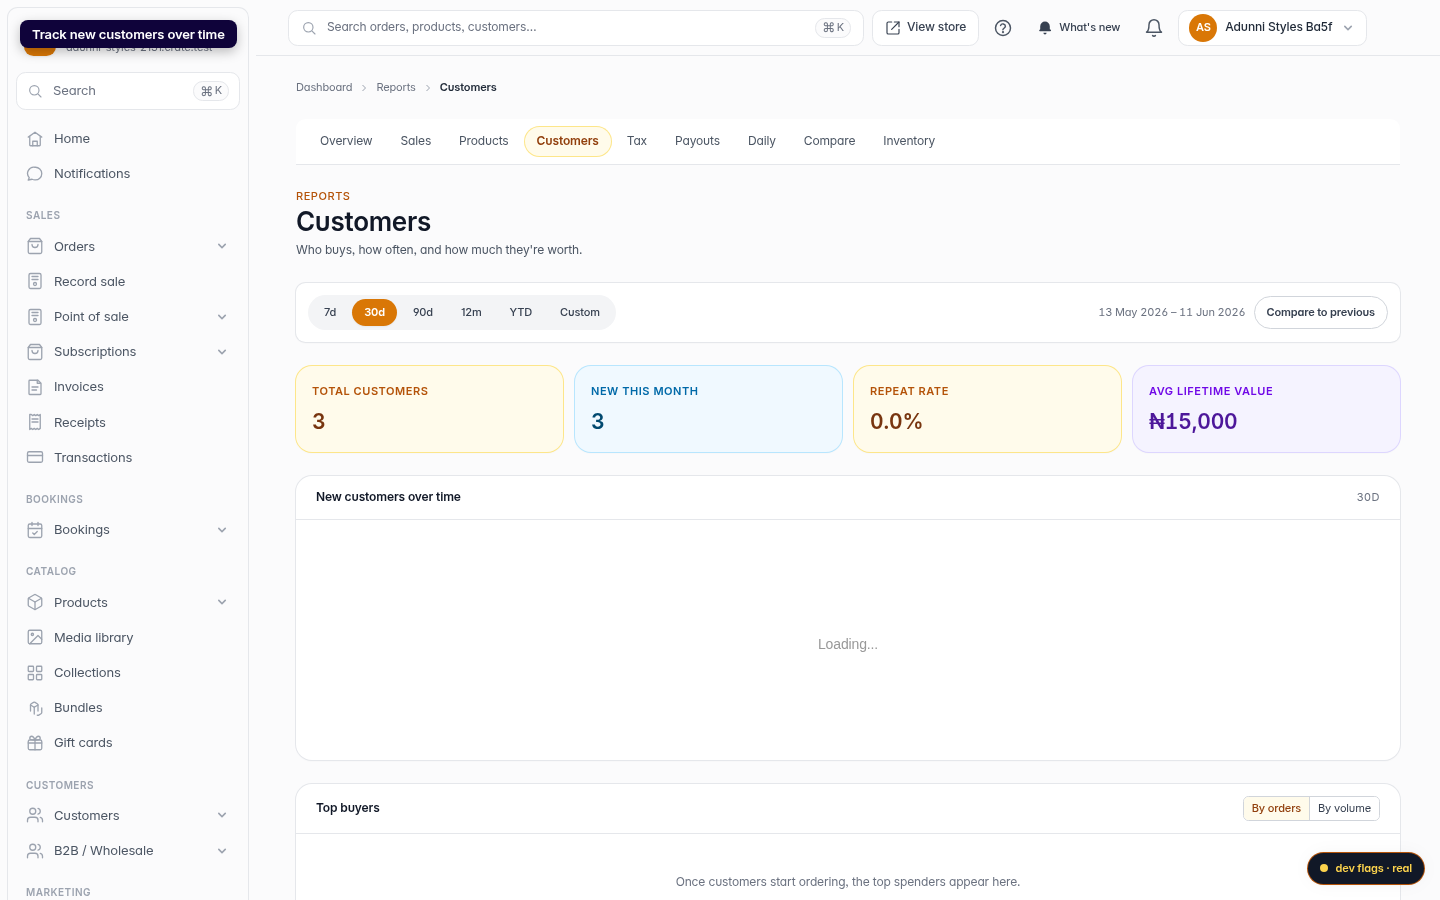
The chart underneath the tiles plots, day by day, how many customers placed their first order. A steady or rising line means your acquisition is working; a flat one is your cue to lean on marketing and campaigns.
Tip: Watch repeat rate and lifetime value together. If both are rising, the customers you win are sticking around and spending more — the two healthiest things that can happen to a store.
Picking a period and comparing
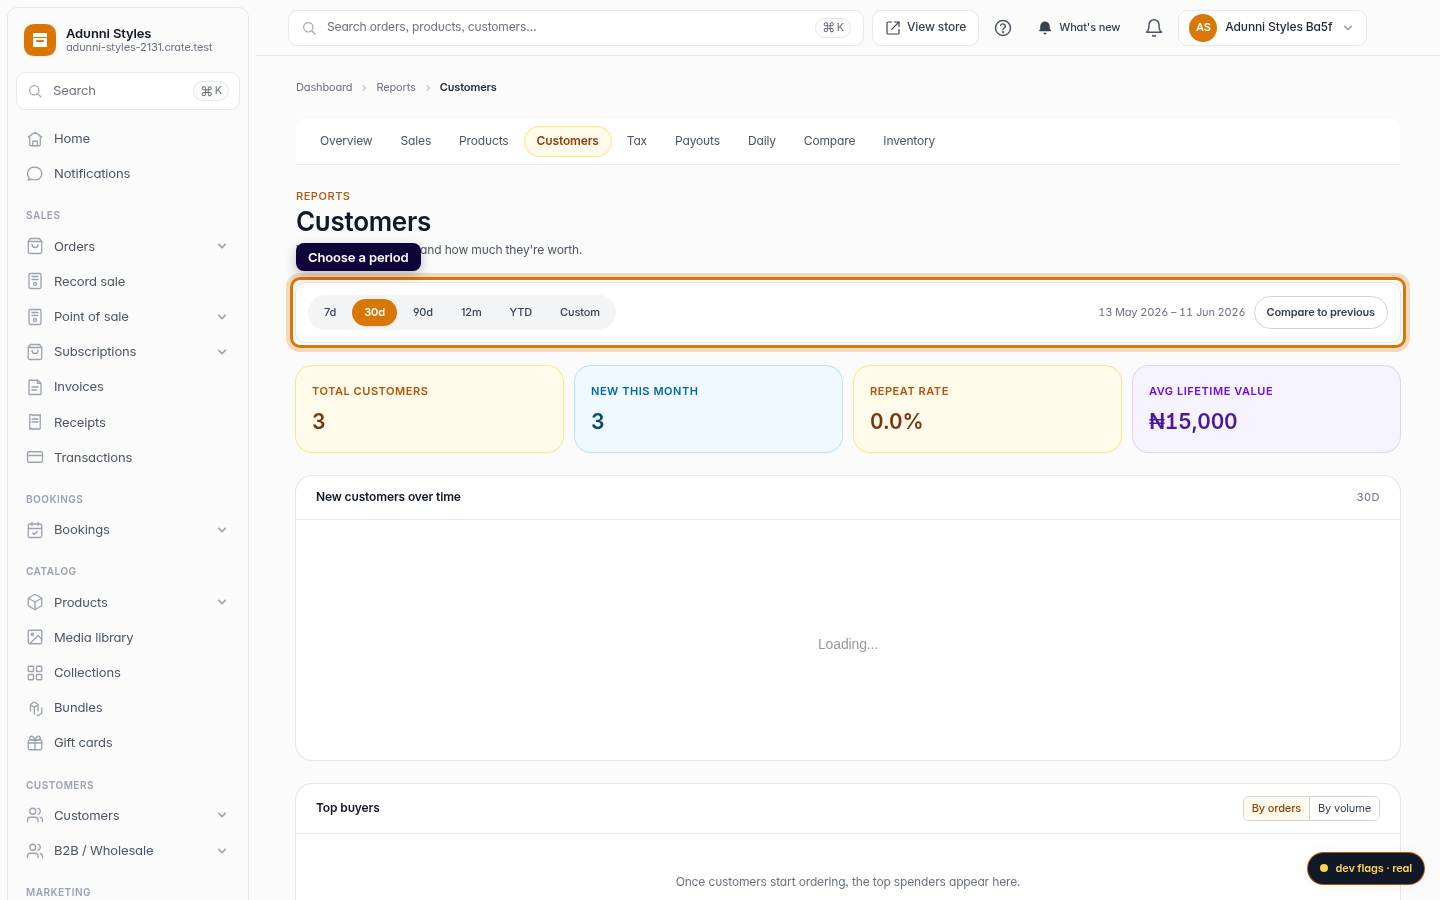
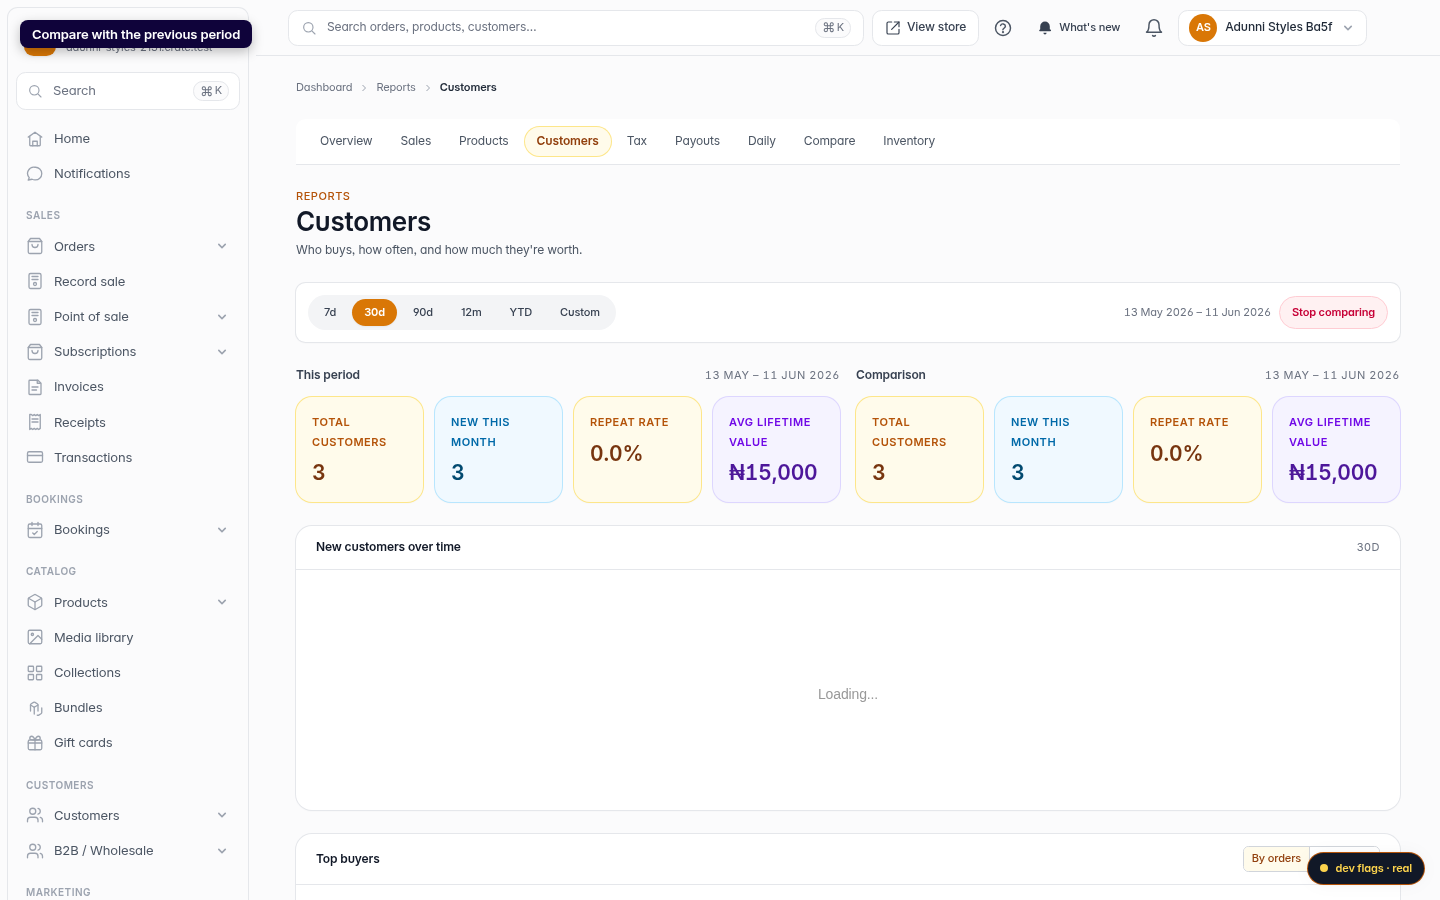
The period chips re-query the tiles and the chart at once. Choose Custom for an exact range, set the dates and click Apply. Toggle Compare to previous to lay this period beside the one immediately before it — last 30 days against the 30 before — so growth (or a dip) is impossible to miss. Click Stop comparing to return to a single view.
-
1
Open Reports
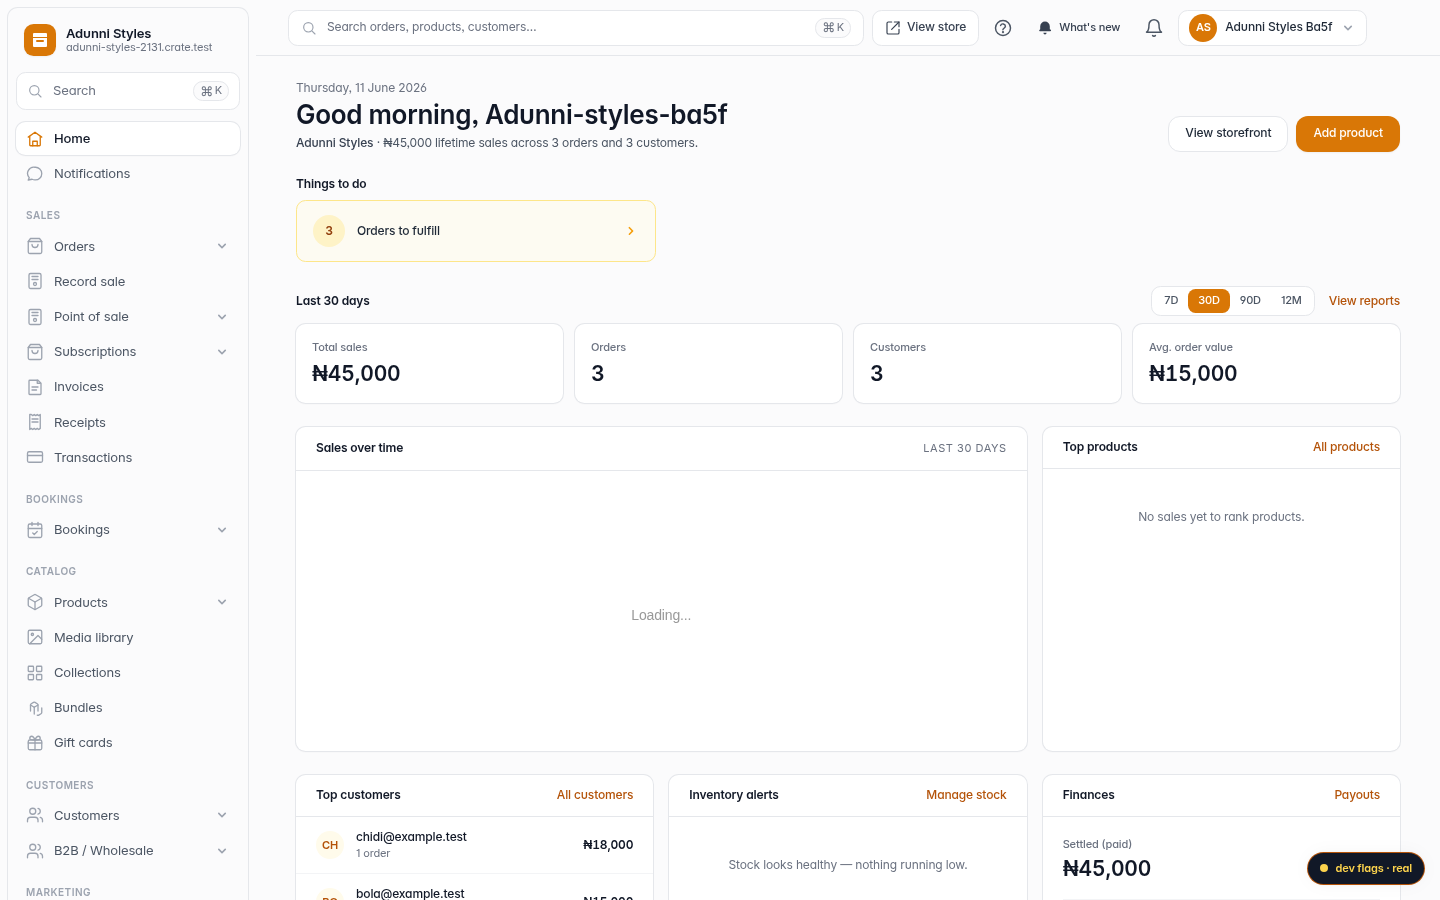
From your Crate dashboard, open Reports in the left sidebar.
Web -
2
Open the Customers report
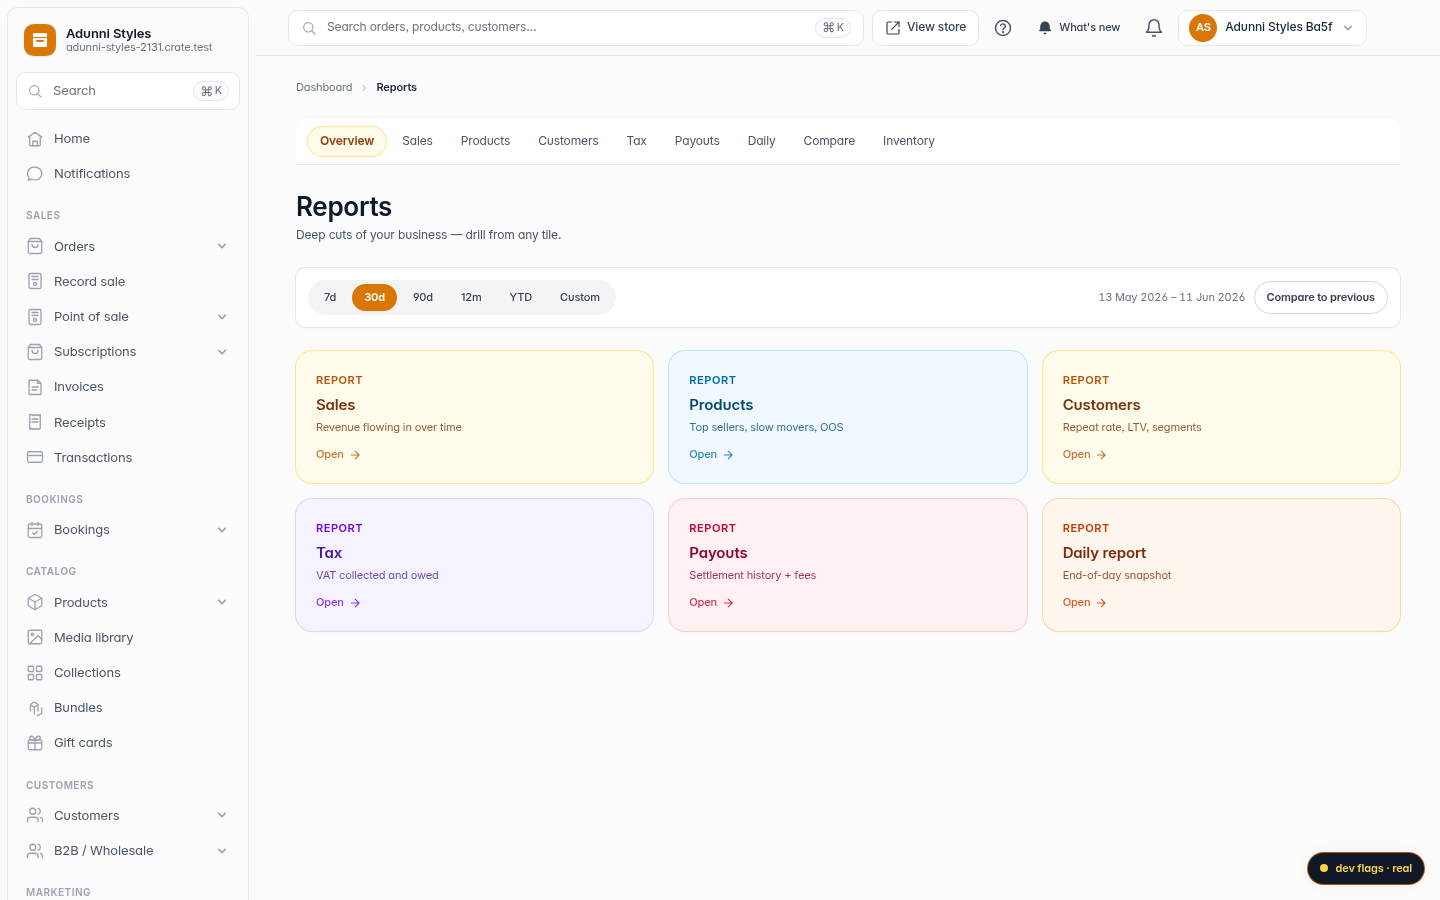
In the Reports sub-nav, click Customers. Crate opens your customer view.
Web -
3
Read the customer tiles
The four tiles summarise your buyers: Total customers, New this month, Repeat rate (the share who've ordered more than once) and Avg lifetime value (total spend divided across all customers).
Web -
4
Track new customers over time
The New customers over time chart plots the day each customer placed their very first order, so you can see whether your store is winning fresh buyers.
Web -
5
Choose a period
Use the period chips — 7d, 30d, 90d, 12m, YTD or Custom — to set the window. The tiles and chart re-query instantly.
Web -
6
Compare with the previous period
Click Compare to previous to put this period next to the one before it, so you can see whether your customer base is growing.
Web